3d mapping with Aerialod and QGIS
Introduction
Aerialod is a small but versatile piece of software for visualizing raster data in three dimensions. Better than small, I should say minimalistic, which is actually a strength, especially for the new users, allowing them to play with 3D data in a very straightforward manner.
More powerful and complete tools, like Blender, can be intimidating at first, and its complexity can easily overwhelm the user.
This tutorial aims to introduce the basic aspects of the software and how to export data from QGIS to make cool visualizations of geospatial data.
We’ll be making two kinds of 3d maps, one representing population data as elevations and another representing just elevations, like a physical map, but exaggerated by a constant factor.
The latter may be easier to understand, because we are used to this kind of representation. On the contrary, the first visualization could be a little confusing.
In order to follow the tutorial, you’re expected to have a basic command of QGIS, familiarity with vector and raster data models and an understanding of geographical projections.
Unfortunately, Aerialod is only available for Windows. You may try an emulator if you don't have access to a Windows machine, but I don’t know if that will work.
Getting the data
We’ll use three sources for the data.
Vector data
Natural Earth pre-processed data, boundaries to clip the rasters.
Pick the country you prefer:
Kontur population data, pick the country you prefer.
Raster data
Africa SRTM pre-processed digital elevation model or DEM
Exploring a digital elevation model in Aerialod
First, let’s try to become familiar with Aerialod, by exploring its options. You can download the software here.
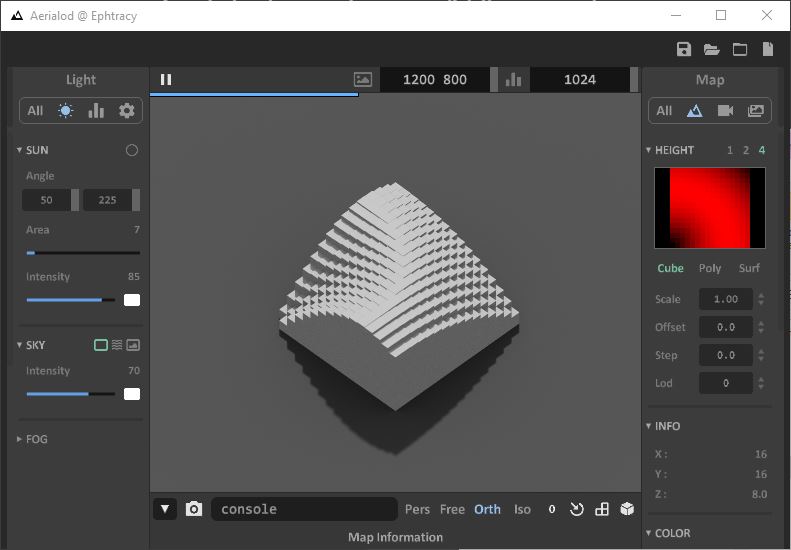
Once downloaded, unzip it and open Aerialod.exe, you’ll see this screen:
I pre-processed a digital elevation model (DEM) for Africa, from NASA’s SRTM data, obtained with the Google Earth Engine Plugin in QGIS.
You have to download it from the link, and then unzip it. Once you unzip it, just drag-and-drop the TIF file into the Aerialod window. If nothing happens, check that the path where the TIF is placed does not contain any special characters.
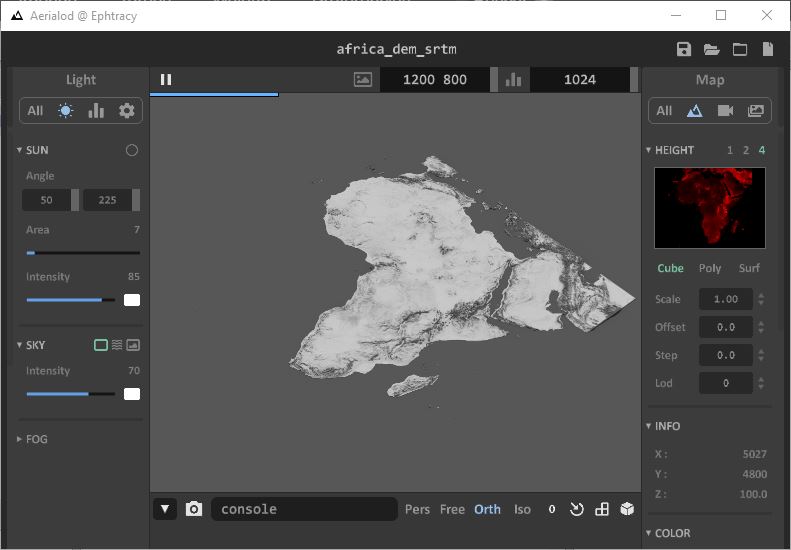
Once you loaded the DEM, you can move using your mouse, pressing the scroll wheel to pan (or press and hold the space bar while left-clicking) and the right button to change the angle and inclination.
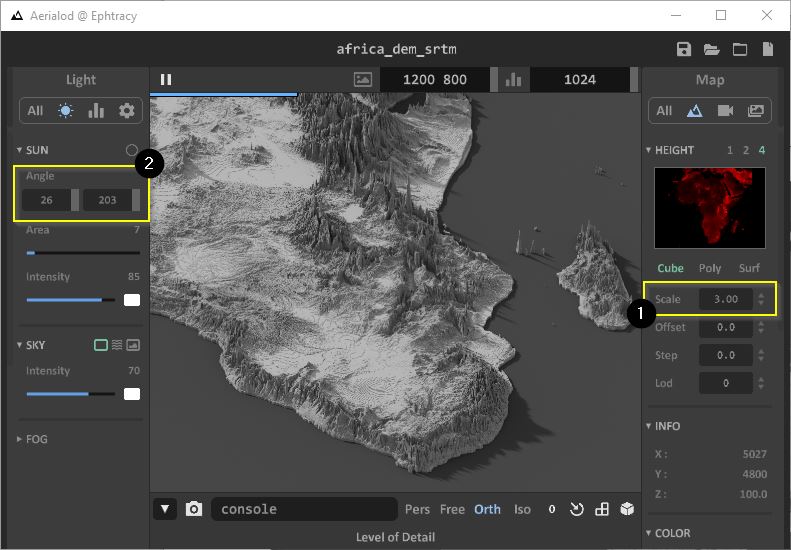
If you can navigate the image with confidence, our next step would be to exaggerate the DEM (scale), so the values are multiplied by a constant, giving a more realistic sense of elevation. You can use the scale control to do this.
Also, play around with the sun angle, to get different types of light and casting shadows.
You can also play with the offset, step and lod settings, to see their functionality. What is more, you can play with all the controls as you please! I’m not going to go deep into all the possibilities.
Pre-processing the Kontur population dataset
This dataset is amazing. It consists of a population count aggregated at 400m H3 Hexagons, the global multiscale grid made by Uber.
The data can be downloaded for the whole globe or by countries. Since working with smaller datasets is easier for a tutorial, we’ll go with the countries. In this case, I’ll use France. If you’re interested in how this data was made, please refer to the documentation.
The grid is in vector format, so we’ll have to rasterize it in order to work with Aerialod, and here comes QGIS to the rescue. You can also do this using pure GDAL scripting, Python or ArcGIS among other tools, but I’ll stick to QGIS.
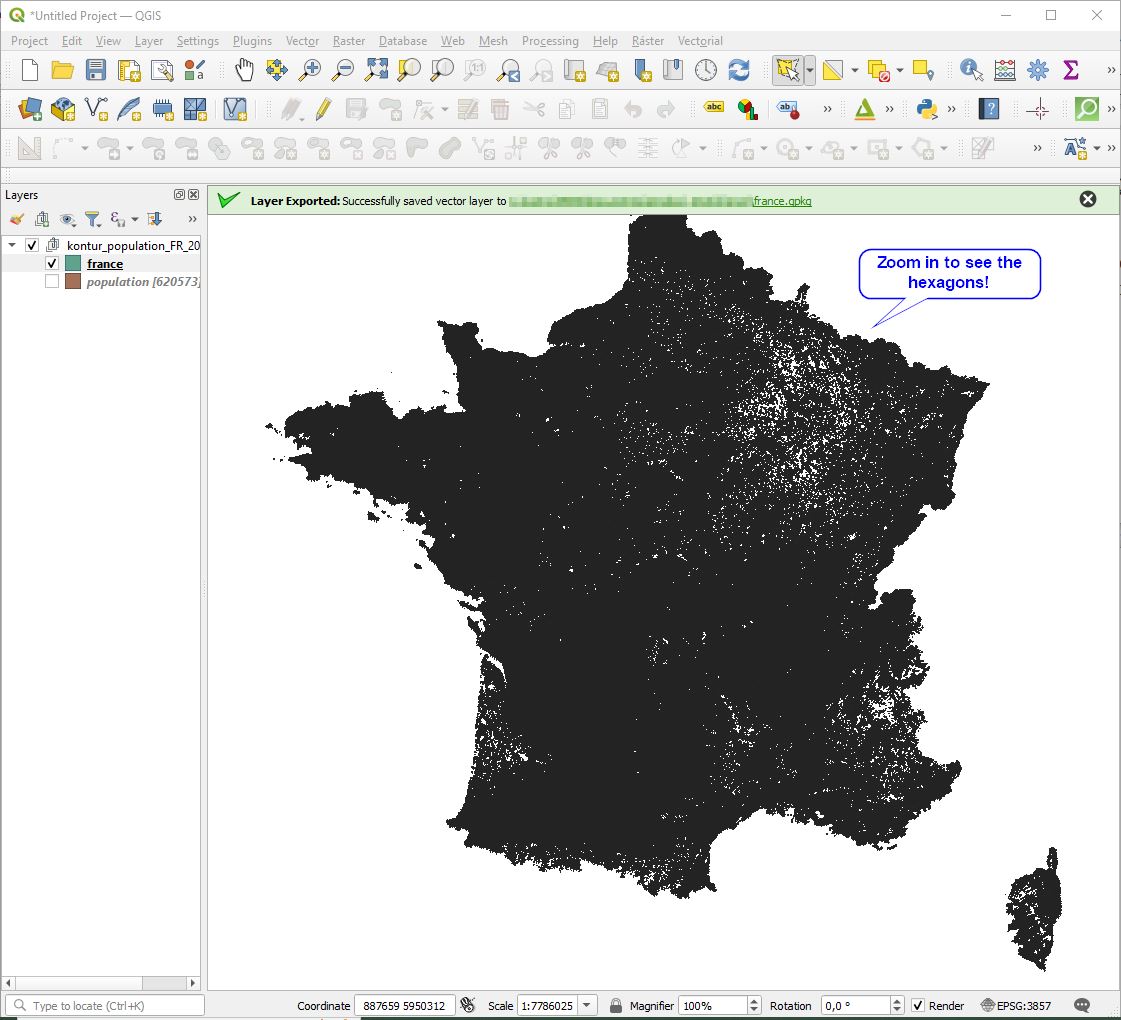
The data comes in compressed GeoPackages. Once downloaded, open a QGIS project and drag-and-drop the files into QGIS. Even if compressed, QGIS will read it. Be aware that the data is in EPSG:3857 CRS, so check if your QGIS project is in the correct CRS before proceeding. We’ll start with France. Since France has territory scattered over the four hemispheres, I selected continental France plus Corsica, and exported the selected hexagons as a new layer (and that's why I included it pre-processed in this tutorial). You can zoom in to see the hexagons.
Now we have to rasterize this vector layer. Open the Processing Toolbox (Ctrl + Alt + T), and search for “rasterize”. Then double-click on the GDAL tool “Rasterize (vector to raster)”.
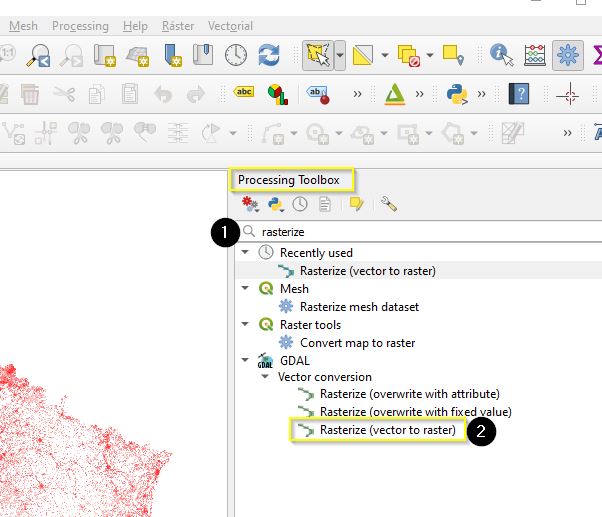
If you don’t have the toolbox, be sure that the "Processing" plugin is activated, go to “Manage and install plugins…” under the “Plugins” menu and check it out.
We’ll use a resolution of 500 m per pixel. There’s no need to save the result, just let the default so QGIS will load it as soon as the processing is finished.
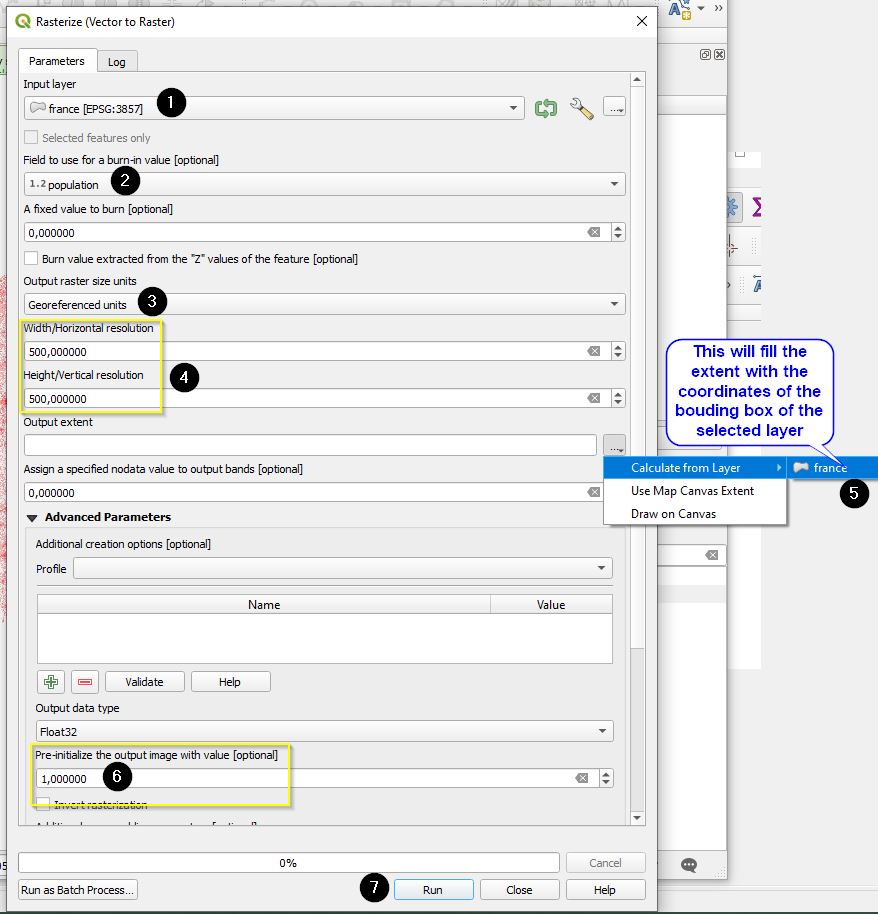
We indicated the GDAL process to pre-initialize the raster with the value 1. We do this is to avoid no-data pixels, which are generated where there are no hexagons.
Now you can load the “france.gpkg” layer, which is continental France and Corsica from the Natural Earth countries dataset, in CRS EPSG:3857 (so-called Web Mercator).
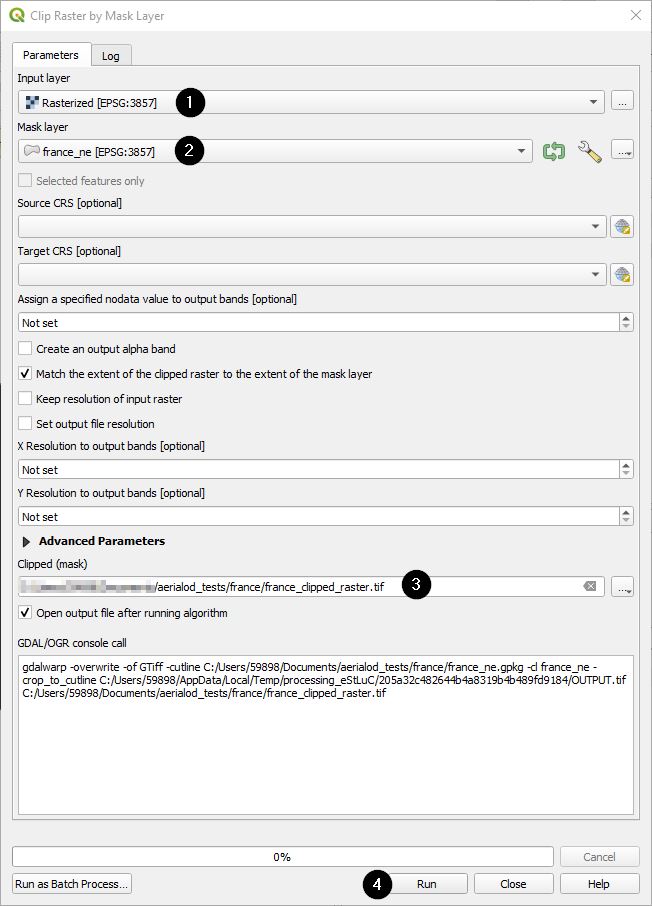
We’ll use this vector layer to clip the raster, so search for “Clip” in the Processing Toolbox and double-click on the “Clip raster by mask layer”.
Use the following settings to clip the layer properly and save the result into a new file.
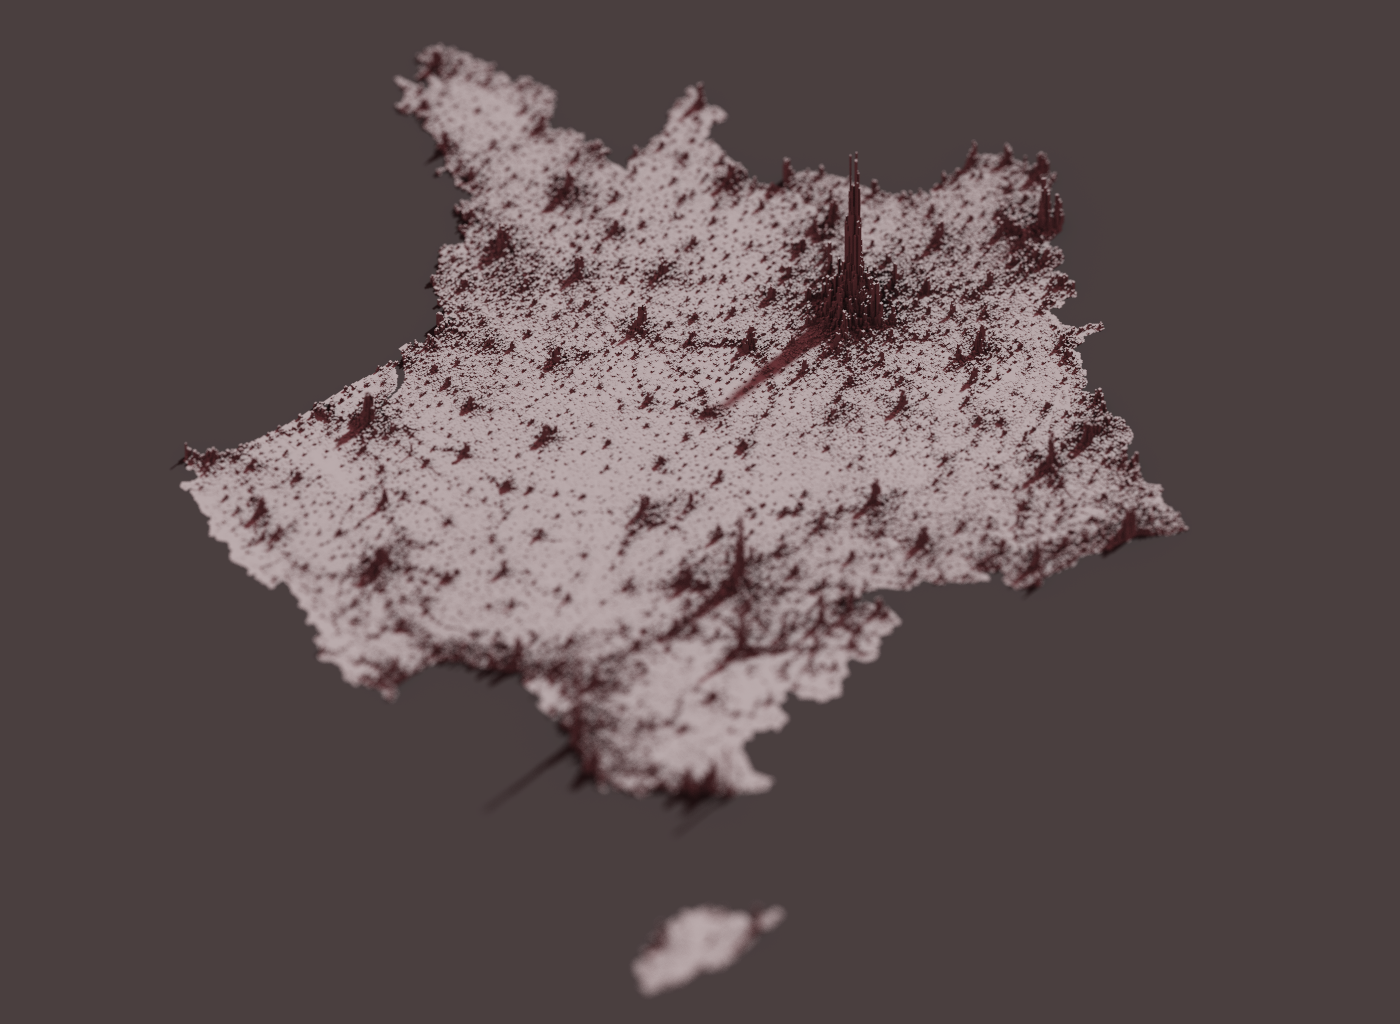
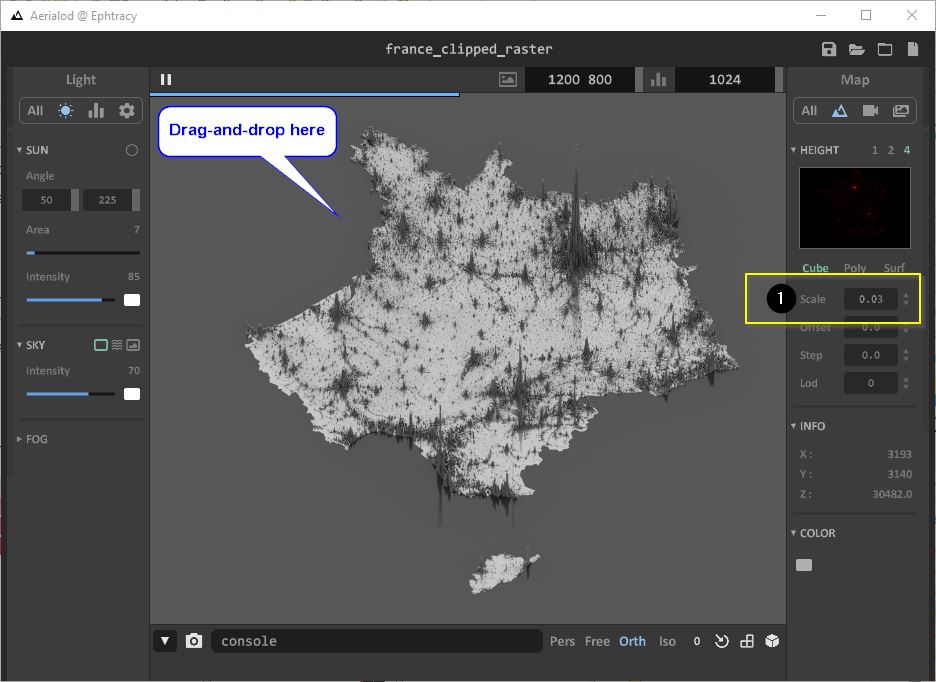
Now you can drag-and-drop the resulting raster to Aerialod, reducing the scale to 0.03 will be enough to make something interesting, so… Voilà!
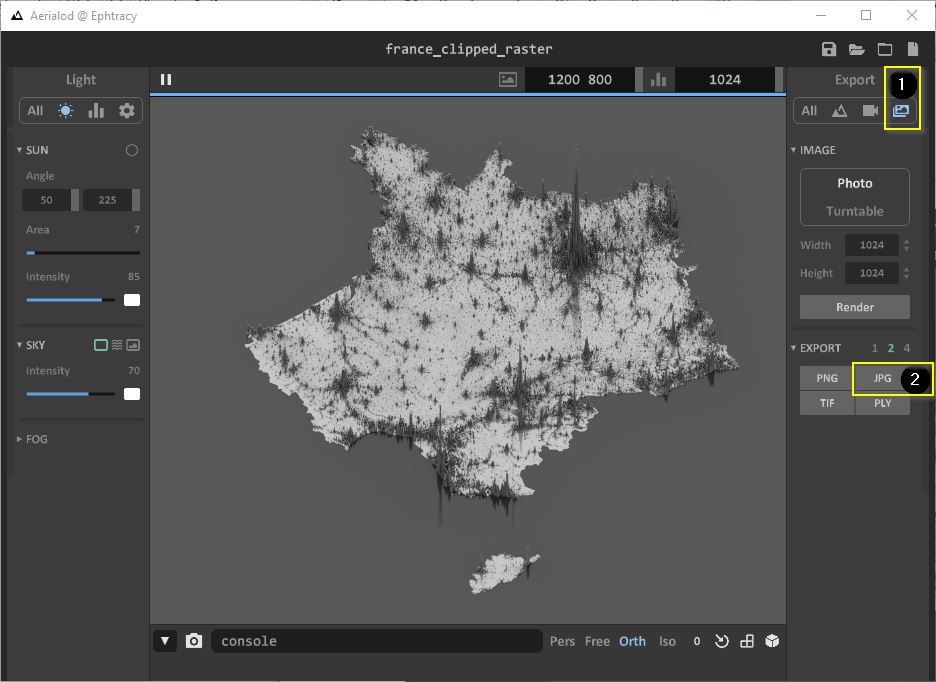
To export your visualization, follow these steps, or click on “Render”:
Final remarks
Aerialod is awesome. However, countries without geographical context looks weird, at least for me.
This could be fixed by “burning” in the raster a value of 1 for the vectors of the neighboring countries. You could also do this for lakes of whatever feature you want to include. You could also use negative values. In conclusion, we are just visualizing 3 variables: X, Y and Z, being Z the height, which is the value of the raster pixel.
All this raster pre-processing can be done with QGIS, so go ahead, I would like to see your creations!
References
Here you can find a more broad introduction to Aerialod: http://www.statsmapsnpix.com/2019/11/amazing-3d-rendering-with-aerialod.html